Ecological pyramids: Numbers, Biomass, Energy with Example
Ecological Pyramids
Ecological pyramids, also known as trophic pyramids, are graphical representations used to illustrate the relationship between different trophic levels in an ecosystem. These levels are based on the position organisms occupy in the food chain, ranging from producers at the base to apex predators at the top. Ecological pyramids help in understanding the flow of energy, the cycling of nutrients, and the overall structure of ecosystem functioning. There are three main types of ecological pyramids:
1. Pyramid of Numbers
This pyramid displays the number of organisms at each trophic level in an ecosystem. It shows the vast number of primary producers (like plants) needed to support a smaller number of primary consumers (like herbivores), which in turn support an even smaller number of secondary consumers (like carnivores), and so on. However, the shape of the pyramid can vary depending on the ecosystem.
Upright Pyramid of Numbers
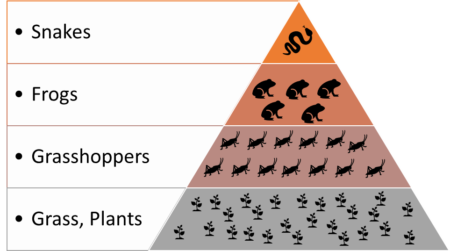
Example: A grassland ecosystem can serve as an example of an upright Pyramid of Numbers. Here, the base of the pyramid would consist of a vast number of grass plants (producers). The next level would have fewer grasshoppers that feed on the grass, followed by an even smaller number of frogs that eat the grasshoppers. At the top, there might be a very small number of snakes that prey on the frogs. This pyramid clearly shows how the number of organisms decreases as one moves up the trophic levels from producers to apex predators.
Inverted Pyramid of Numbers
Example: A good example of an inverted Pyramid of Numbers can be found in a forest ecosystem dominated by a few large trees (producers). These trees can support a large number of herbivorous insects (primary consumers). In turn, these insects can support an even larger number of insectivorous birds (secondary consumers). In this scenario, the base of the pyramid (the trees) is narrower than the levels above it, reflecting the smaller number of large producers supporting a larger number of consumers.
2. Pyramid of Biomass
This type of pyramid represents the total biomass at each trophic level. Biomass is the total mass of living or organic matter in a given area or volume. The pyramid of biomass illustrates the decrease in biomass from the base (producers) to the top (apex predators) of the food chain. This decrease occurs because energy is lost at each trophic level due to metabolic processes and as heat. Like the pyramid of numbers, the shape can vary.
Upright Pyramid of Biomass
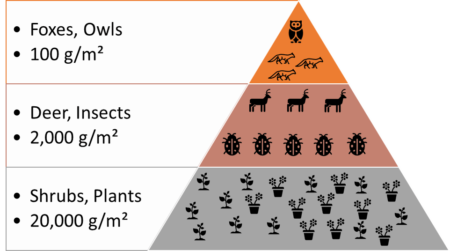
Example: A terrestrial ecosystem, such as a forest, typically exhibits an upright Pyramid of Biomass. In this ecosystem, the vast biomass of trees and other plants (producers) supports a smaller biomass of herbivores (primary consumers), such as deer and insects. This, in turn, supports an even smaller biomass of carnivores (secondary consumers), such as wolves or birds of prey. The pyramid is upright because the biomass decreases from the base (producers) to the apex (top predators).
Inverted Pyramid of Biomass
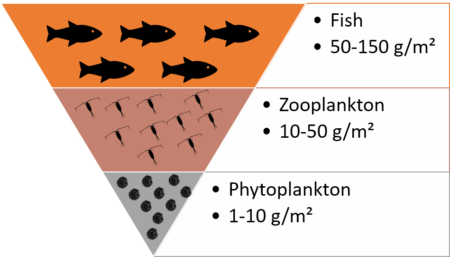
Example: An aquatic ecosystem, such as an ocean or a lake, can exhibit an inverted Pyramid of Biomass. In these ecosystems, the primary producers are often phytoplankton, which have a relatively small total biomass at any given moment due to their rapid turnover rate (they grow and are consumed quickly). However, this small biomass of phytoplankton can support a larger biomass of zooplankton (primary consumers), because the phytoplankton reproduce quickly enough to sustain them. The zooplankton, in turn, support a smaller biomass of small fish (secondary consumers), and so on. The pyramid is inverted because the biomass of consumers at certain levels can exceed the biomass of the producers due to the high productivity and rapid turnover of the phytoplankton.
3. Pyramid of Energy
This is considered the most accurate representation of energy flow in an ecosystem. It shows the amount of energy (usually in units of calories or joules) that is present at each trophic level and transferred from one level to the next. Only a fraction (usually about 10%) of the energy at each trophic level is transferred to the next level; the rest is lost primarily as metabolic heat. This pyramid is always upright because energy flow in an ecosystem is unidirectional, from the sun to producers and then through the various consumer levels.
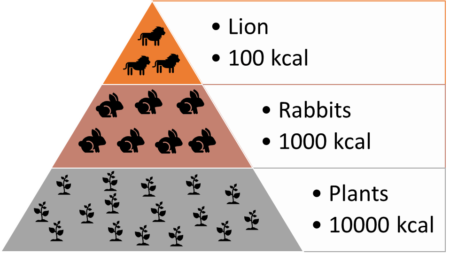
Example: Consider a simple grassland ecosystem. The base of the Pyramid of Energy would be composed of the solar energy captured by plants (producers). If plants capture 10,000 units of energy from the sun, only about 1,000 units might be transferred to primary consumers (herbivores like rabbits) that eat the plants. Then, only about 100 units of energy would be available to secondary consumers (carnivores like foxes) that eat the herbivores. At each step, the energy available decreases, illustrating why the pyramid remains upright.
Inverted Pyramid of Energy
The concept of an inverted Pyramid of Energy does not apply because energy flow in ecosystems is unidirectional and decreases with each transfer. Unlike the Pyramids of Numbers and Biomass, which can be inverted due to specific ecological conditions or the physical structure of certain ecosystems (e.g., aquatic ecosystems with a high turnover rate of phytoplankton), the Pyramid of Energy consistently shows a decrease in energy from the base (producers) to the apex (top predators). This consistent decrease in available energy at higher trophic levels is a fundamental principle of ecosystem dynamics and underscores the inefficiency of energy transfer between trophic levels.
Ecological pyramids provide valuable insights into the efficiency of energy transfer, the impact of human activities on ecosystems, and the potential for sustainability within ecosystems. They are fundamental concepts in ecology and environmental science, helping to illustrate the intricate connections and dependencies among living organisms.


